


ECC Dashboard™
The ECC Technologies Dashboard™ is a powerful, interactive platform designed to streamline infrastructure planning, pre-planning, construction, and project management. By integrating dynamic mapping, real-time analytics, and collaboration tools, the dashboard enables multi-agency coordination and data-driven decision-making. It brings together critical datasets—including demographics, employment, agriculture, public lands, gas production, business activity, housing, healthcare, tourism, education, and transportation—to provide stakeholders with real-time insights that support strategic planning and optimize infrastructure investments.
Customizable Data Layers
The dashboard integrates a comprehensive set of customizable data layers, providing insights into key sectors that impact infrastructure development and investment. Each data layer is customizable and can be tailored to specific projects, ensuring that decision-makers have the right information to drive effective planning and policy development.
Personalized Dashboards for Targeted Insights
Government Agencies – Public infrastructure insights, urban planning analytics, and zoning data overlays.
Utility Companies – Real-time network monitoring, predictive maintenance, and service area expansion analysis.
Engineering & Construction Firms – Project tracking, feasibility studies, and compliance monitoring tools.
Economic Development Organizations – Business density analysis, investment attraction insights, and land-use optimization.
Advanced Analytics and Reporting
To support data-driven infrastructure decision-making, the GIS Dashboard includes sophisticated analytics and reporting tools, such as:
Predictive modeling to assess infrastructure impact and optimize project planning.
Scenario analysis for budget forecasting, investment planning, and risk assessment.
Custom dashboards with key performance indicator (KPI) tracking, tailored to specific user needs.
These features allow users to visualize trends, predict future demands, and optimize resource allocation, improving the efficiency and effectiveness of infrastructure projects.
Interactive Map Interface
The ECC Technologies GIS Dashboard™ features a user-friendly, interactive GIS platform that visualizes infrastructure, demographics, and economic indicators through dynamic mapping tools. This allows users to:
Navigate infrastructure projects and service areas through an intuitive, layer-based mapping system.
Access real-time data updates to make informed decisions on planning and resource allocation.
Utilize customizable map views to focus on specific project needs, such as broadband expansion, zoning regulations, or economic development.
Mobile Compatibility and Real-Time Field Data Collection
In today’s fast-paced environment, access to real-time data is essential. ECC Technologies dashboard is mobile compatible enabling field teams to collect, update, and analyze data directly from the field on tablets or other devices, ensuring that your geographic data is always current.
Real-Time Data Collection: Allows users to collect geographic data in real-time, providing immediate access to critical information and reducing the time between data collection and analysis.
Offline Functionality: The dashboard provides a solution that works even in remote or disconnected environments, allowing users to collect and store data offline and sync it once connectivity is restored.
GPS-Based Asset Tracking: Asset tracking and issue reporting, streamlining on-site inspections and maintenance workflows.
Pre-Planning and Project Management Tools
The ECC Technologies GIS Dashboard™ includes advanced project planning and management capabilities, allowing stakeholders to:
Conduct feasibility analysis to evaluate infrastructure project viability and cost-effectiveness.
Automate permit tracking and regulatory compliance management, ensuring smooth project execution.
Monitor real-time construction progress with predictive timeline projections for better resource allocation.
Facilitate multi-agency collaboration, allowing for seamless coordination across government entities, private stakeholders, and infrastructure developers.
These tools enable efficient project oversight, streamlined workflows, and data-driven decision-making, reducing project delays and optimizing investments.
Role-Based Access and Customizable User Experience
To ensure security and usability, the platform provides role-based access control (RBAC) and custom views tailored to different stakeholder needs.
Secure & Tailored User Access
Custom permission levels for government officials, engineers, utility companies, and project managers.
Multi-agency collaboration tools allowing organizations to share data while maintaining access restrictions.
Audit logs & usage tracking to ensure compliance and transparency in data access.
Make Ready, Construction, and Permit Tracking Tool
ECC Technologies' Make Ready, Construction, and Permit Tracking Tool centralizes network design, make-ready processes, construction, and maintenance into a single, intuitive platform.
Utilizing custom Arcade scripts, the dashboard dynamically visualizes data, providing insights that help estimate timelines and costs effectively.
It highlights problematic segments that require attention and allows users to issue construction and maintenance work orders directly from the interface.
Fully integrated with field maps, this dashboard enhances operational efficiency and improves project management, ensuring smooth execution from planning through to completion.
Broadband Feasibility Tool
ECC Technologies' Broadband Feasibility Tool provides a comprehensive analysis of broadband potential by sorting H3 data based on defined parameters.
Users can assess factors such as the Social Vulnerability Index (SVI), demographics, existing broadband infrastructure, cost/revenue projections, and available grants.
This powerful tool equips stakeholders with the insights needed to evaluate feasibility accurately, guiding strategic decisions for expanding broadband access in targeted communities.
With its intuitive interface, the dashboard simplifies the complex process of feasibility studies, making it easier to identify opportunities and challenges in broadband deployment.
FCC Broadband Data Visualization
ECC Technologies' FCC Broadband Data Visualization leverages H3 hexagon mapping to present a comprehensive view of broadband coverage.
This tool integrates FCC broadband data, ACS demographics, grant availability, community anchor locations, take rates, and ECC's custom broadband feasibility score.
When used alongside the ECC Fiber Design Planner, this powerful visualization helps maximize network coverage and identify the most strategic locations for broadband deployment, ensuring optimal planning and resource allocation.
Automated Fiber Design Planner
ECC Technologies' Automated Fiber Design Planner streamlines the fiber build process with powerful, intuitive tools.
The planner quickly draws routes along the shortest and most suitable paths, ensuring efficient network designs.
Custom geoprocessing tools allow for seamless editing and creation of polylines.
The system also determines aerial, underground, or IRU pathways while providing cost estimates.
Built-in tracking for permit requirements and field notes, users stay organized and informed throughout the project.
Data export options include GEOJSON, SHP, and KMZ formats, along with CSV exports of Location IDs within adjustable buffers for added flexibility.
Streetview Integration
ECC Technologies' Streetview Integration leverages the power of the Google Streetview API to enhance fiber network design. When used in tandem with the ECC Fiber Design Planner, users can navigate roads in Streetview and draw routes directly on the map in real time.
This integration offers a more immersive and accurate design experience, ensuring that routes are optimized for real-world conditions while maintaining seamless interaction with other planning tools.
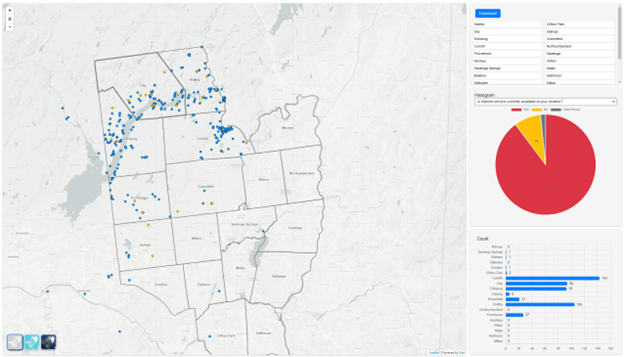
Survey123 Visualization
ECC Technologies' Survey123 Visualization tool enables users to visualize real-time survey data effortlessly through Leaflet, utilizing the ArcGIS REST API. This integration provides an interactive and dynamic mapping experience, allowing stakeholders to access and analyze survey results as they come in. With user-friendly visuals, organizations can make informed decisions based on up-to-date data, enhancing project management and community engagement.
Contact us today for a free demo!
Whether you’re planning infrastructure builds, tracking progress, or making data-driven decisions, our team can tailor a solution that fits your exact needs.